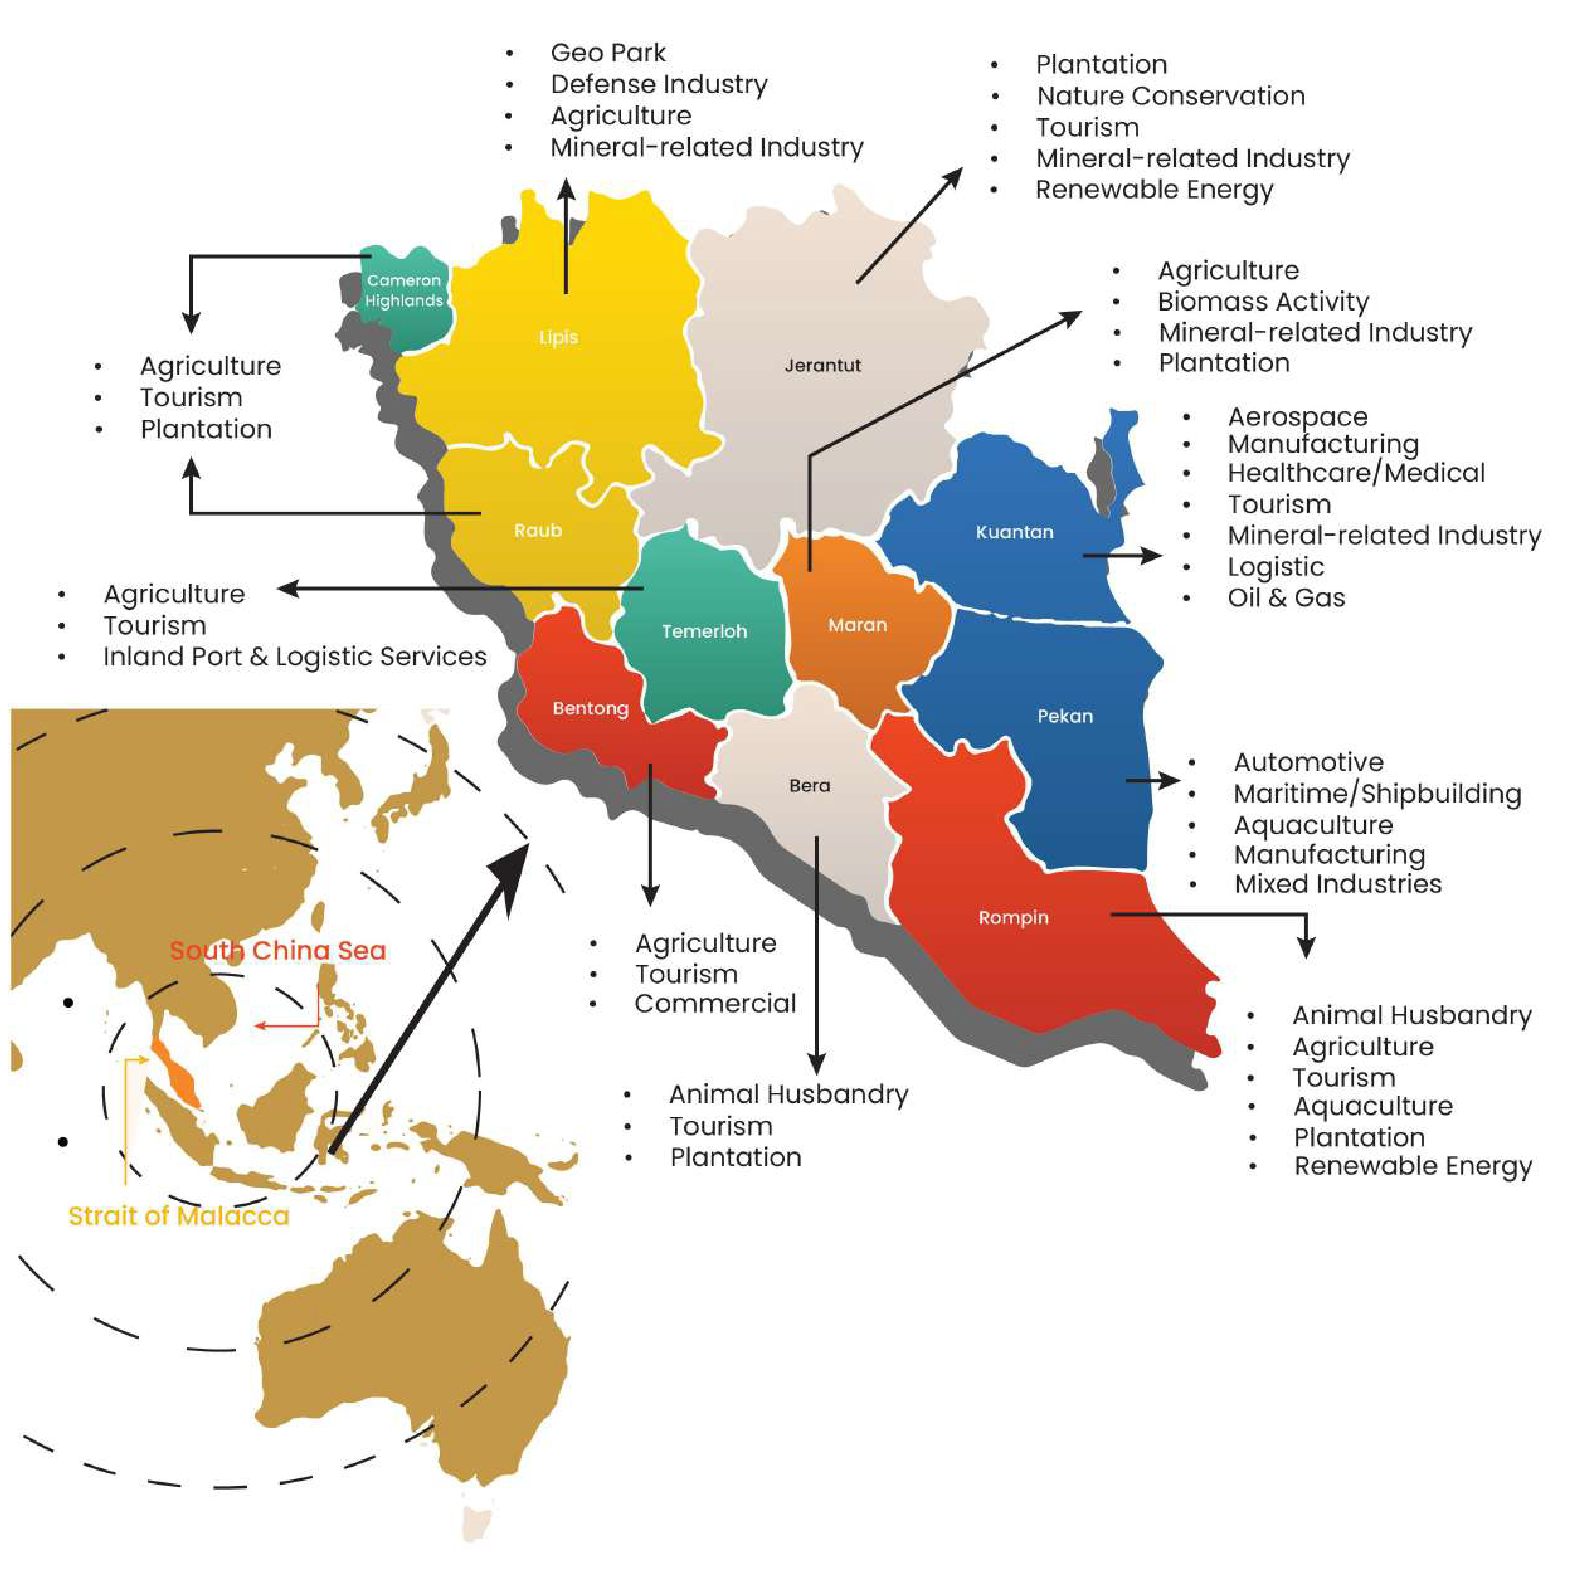
Please visit the official website of 'Invest In Pahang' for a full reference of industrial information under the supervision of PKNP.

Industrial Areas in Bentong 2A
Industrial Areas in Bentong 2B
Industrial Areas in Padang Tengku, Lipis
Pahang State Halal Food Complex, Gambang
Taman Tenaga Baharu, Pekan
Kawasan Pembangunan Akuakultur, Tg. Batu
BASF Petronas Chemicals Sdn. Bhd.
RP Chemicals Sdn. Bhd.
Eastman Chemicals (M) Sdn. Bhd.
W.R. Grace Specialty Chemicals Sdn. Bhd.
Polyplastic Asia Pacific Sdn. Bhd.
Kaneka (M) Sdn. Bhd.
Cryovac (M) Sdn. Bhd.
Flexsys Chemical (M) Sdn. Bhd.
Petronas Chemicals MTBE Sdn. Bhd.
Eco Tower Sdn. Bhd.
Lynas Malaysia Sdn. Bhd.
Asturi Metal Builders (M) Sdn Bhd
Cargill Palm Products Sdn Bhd
Dovechem Chemical Industries (Ktn) Sdn Bhd
Engtex Ductile Iron Pipe Industry Sdn Bhd
Wasco Coatings Malaysia Sdn Bhd
Toray BASF PBT Resin Sdn Bhd
Vega Precision Technology (M) Sdn Bhd
Kompleks Makanan Halal
Malaysia Truck & Bus Sdn. Bhd.
Automotive Manufacturers (M) Sdn. Bhd.
Automotive Service (M) Sdn. Bhd.
Deftech Sdn. Bhd.
Master Radiator Sdn. Bhd.
Master Builder Sdn. Bhd.
Agrobest Sdn. Bhd.
Elektrisola Malaysia Sdn. Bhd.(Janda Baik)
Pascorp Paper Berhad
Rohas Euco Industries Sdn. Bhd.
Boustead Heavy Industries Sdn Bhd
LCS Mix Sdn Bhd
Syarikat Kayu Gaharu (M) Sdn Bhd
Mieco Manufacturing Sdn. Bhd.
PKNP Reneuco Suria Sdn. Bhd.
Number of Manufacturing Projects approved by MITI in the State of Pahang from 1987 to 2021 (September)
| YEAR | PROJECT TOTAL | EMPLOYMENT OPPORTUNITIES | PROJECT VALUE (RM MILLION) |
|---|---|---|---|
| 1987 | 7 | 3,540 | 177.1 |
| 1988 | 21 | 9,501 | 672.3 |
| 1989 | 14 | 2,828 | 848.6 |
| 1990 | 18 | 3,616 | 517.0 |
| 1991 | 11 | 3,748 | 130.4 |
| 1992 | 12 | 1,807 | 811.9 |
| 1993 | 14 | 2,029 | 1,541.3 |
| 1994 | 18 | 7,275 | 561.4 |
| 1995 | 19 | 2,420 | 423.7 |
| 1996 | 26 | 3,374 | 1,718.5 |
| 1997 | 21 | 2,562 | 3,066.2 |
| 1998 | 30 | 2,331 | 2,462.5 |
| 1999 | 14 | 2,599 | 328.2 |
| 2000 | 25 | 2,362 | 2,830.4 |
| 2001 | 22 | 2,645 | 347.2 |
| 2002 | 13 | 701 | 271.3 |
| 2003 | 17 | 2,476 | 925.4 |
| 2004 | 18 | 1,571 | 994.7 |
| 2005 | 18 | 1,870 | 2,203.17 |
| 2006 | 33 | 1,680 | 1,792.56 |
| 2007 | 28 | 1,467 | 1,563.76 |
| 2008 | 23 | 2,441 | 1,080.8 |
| 2009 | 17 | 943 | 604.8 |
| 2010 | 13 | 745 | 1,038.7 |
| 2011 | 25 | 1,392 | 3,037.9 |
| 2012 | 16 | 1,850 | 2,091.1 |
| 2013 | 17 | 1,378 | 2,818.8 |
| 2014 | 18 | 4,295 | 5,200.4 |
| 2015 | 12 | 477 | 1,073.0 |
| 2016 | 19 | 1328 | 883.11 |
| 2017 | 19 | 5,041 | 2,962.0 |
| 2018 | 15 | 4,630 | 8,028.4 |
| 2019 | 34 | 3,319 | 4,943.0 |
| 2020 | 30 | 1,930 | 4,784.5 |
| 2021 (September) | 13 | 4,263 | 10,118.59 |
| TOTAL | 670 | 96,434 | 72,848.00 |
Source: MIDA until September 2021
Date Updated : 12 January 2022
Foreign Investors Rank in Pahang
Foreign Investment approved until 1987 - 2021 (September)
| FOREIGN COUNTRY | PROJECT NO | PROJECT VALUE (RM MILLION) | TOTAL WORKERS |
|---|---|---|---|
| GERMANY | 36 | 5,388.79 | 4,110 |
| UNITED KINGDOM | 27 | 742.55 | 2,358 |
| USA | 32 | 3,829.60 | 3,416 |
| JAPAN | 68 | 5,442.12 | 8,571 |
| NORWAY | 3 | 234.20 | 322 |
| SINGAPURA | 55 | 738.66 | 8,834 |
| BELGIUM | 1 | 8.8 | 90 |
| TAIWAN | 38 | 608.3 | 10,880 |
| CHINA | 34 | 24,631.82 | 15,160 |
| SWITZERLAND | 3 | 125.8 | 290 |
| FRANCE | 5 | 16.8 | 408 |
| SWEDEN | 3 | 5.01 | 218 |
| RUSSIA | 1 | 12 | 81 |
| LIECHTENSTEIN | 3 | 107.5 | 373 |
| NETHERLANDS | 15 | 590.8 | 722 |
| THAILAND | 5 | 32.1 | 264 |
| KOREA | 17 | 355.18 | 1,546 |
| AUSTRALIA | 17 | 700.90 | 1,348 |
| INDIA | 12 | 396.8 | 1,342 |
| EGYPT | 1 | 14.2 | 150 |
| ITALY | 15 | 284.9 | 1,282 |
| CAYMEN ISLAND | 1 | 7.6 | 192 |
| PAKISTAN | 1 | 0.98 | 24 |
| BRITISH VIRGIN ISLAND | 2 | 972.5 | 404 |
| NEW ZEALAND | 1 | 1.6 | 20 |
| SRI LANKA | 2 | 20.3 | 897 |
| INDONESIA | 6 | 439.7 | 1,214 |
| CANADA | 6 | 98.3 | 474 |
| DENMARK | 2 | 89.1 | 160 |
| HONG KONG | 20 | 2,672.08 | 10,599 |
| FINLAND | 2 | 293.2 | 238 |
| IRAN | 1 | 9.8 | 22 |
| LUXEMBORG | 1 | 18.5 | 33 |
| TURKEY | 1 | 19.14 | 218 |
| UNITED ARAB EMIRATES | 2 | 57.2 | 132 |
| REPUBLIK KESATUAN SLOVAK | 1 | 8.4 | 95 |
| LAIN-LAIN NEGARA | 66 | 11,305.12 | 9,742 |
| TOTAL | 506 | 60,280.35 | 86,302 |
Source: MIDA until September 2021
Date Updated : 12 January 2022
| UTILITY RATES | INDUSTRY TARIFF | PER KWH |
|---|---|---|
|
Electricity |
Tariff D–Low Voltage Industrial Tariff | |
| For the first 200 kWh (1−200 kWh) per month | RM00.38 | |
| For the next kWh (201 kWh onwards) per month | RM 0.441 | |
| Minimum monthly charge | RM7.20 | |
| Tariff E1-Low Voltage General Industrial Tariff | ||
| For each kilowatt of maximum demand per month | RM29.60 | |
| For all kWh | RM33.70 | |
| Minimum monthly charge | RM600.00 | |
| Tariff E2-Medium Voltage Peak/Off-Peak Industrial Tariff | ||
|
For each kilowatt of maximum demand per month during peak period |
RM33.70 | |
| For all kWh during peak period | RM35.50 | |
| For all kWh during off-peak period | RM21.90 | |
| Minimum monthly charge | RM600.00 | |
| Tariff E3-High Voltage Peak/Off-Peak Industrial Tariff | ||
|
For each kilowatt of maximum demand per month during peak period |
RM35.50 | |
| For all kWh during peak period | RM33.70 | |
| For all kWh during off-peak period | RM20.20 | |
| Minimum monthly charge | RM600.00 | |
|
Water |
PER 100 m³ | |
| The first 0 − 2 hectares | RM15.00 | |
| 100 additional acres | RM10.00 | |
| Minimum charge | RM150.00 | |
|
Sewerage Rates |
PER CONSUMER/ PER MONTH | |
| Premises receiving individual antiseptic services | RM2.00 | |
| Premises receiving connected sewerage services | RM2.00 |
Application
For further informations and application for industrial land, you may send an application letter directly to us :
Manager Industrial Division
Pahang State Development Corporation
Level 15, Teruntum Complex, Jalan Mahkota
25000 Kuantan, Pahang
Tel : 09-5658588, Fax : 09-5134530
OSA PKNP Portal - http://www.investinpahang.gov.my
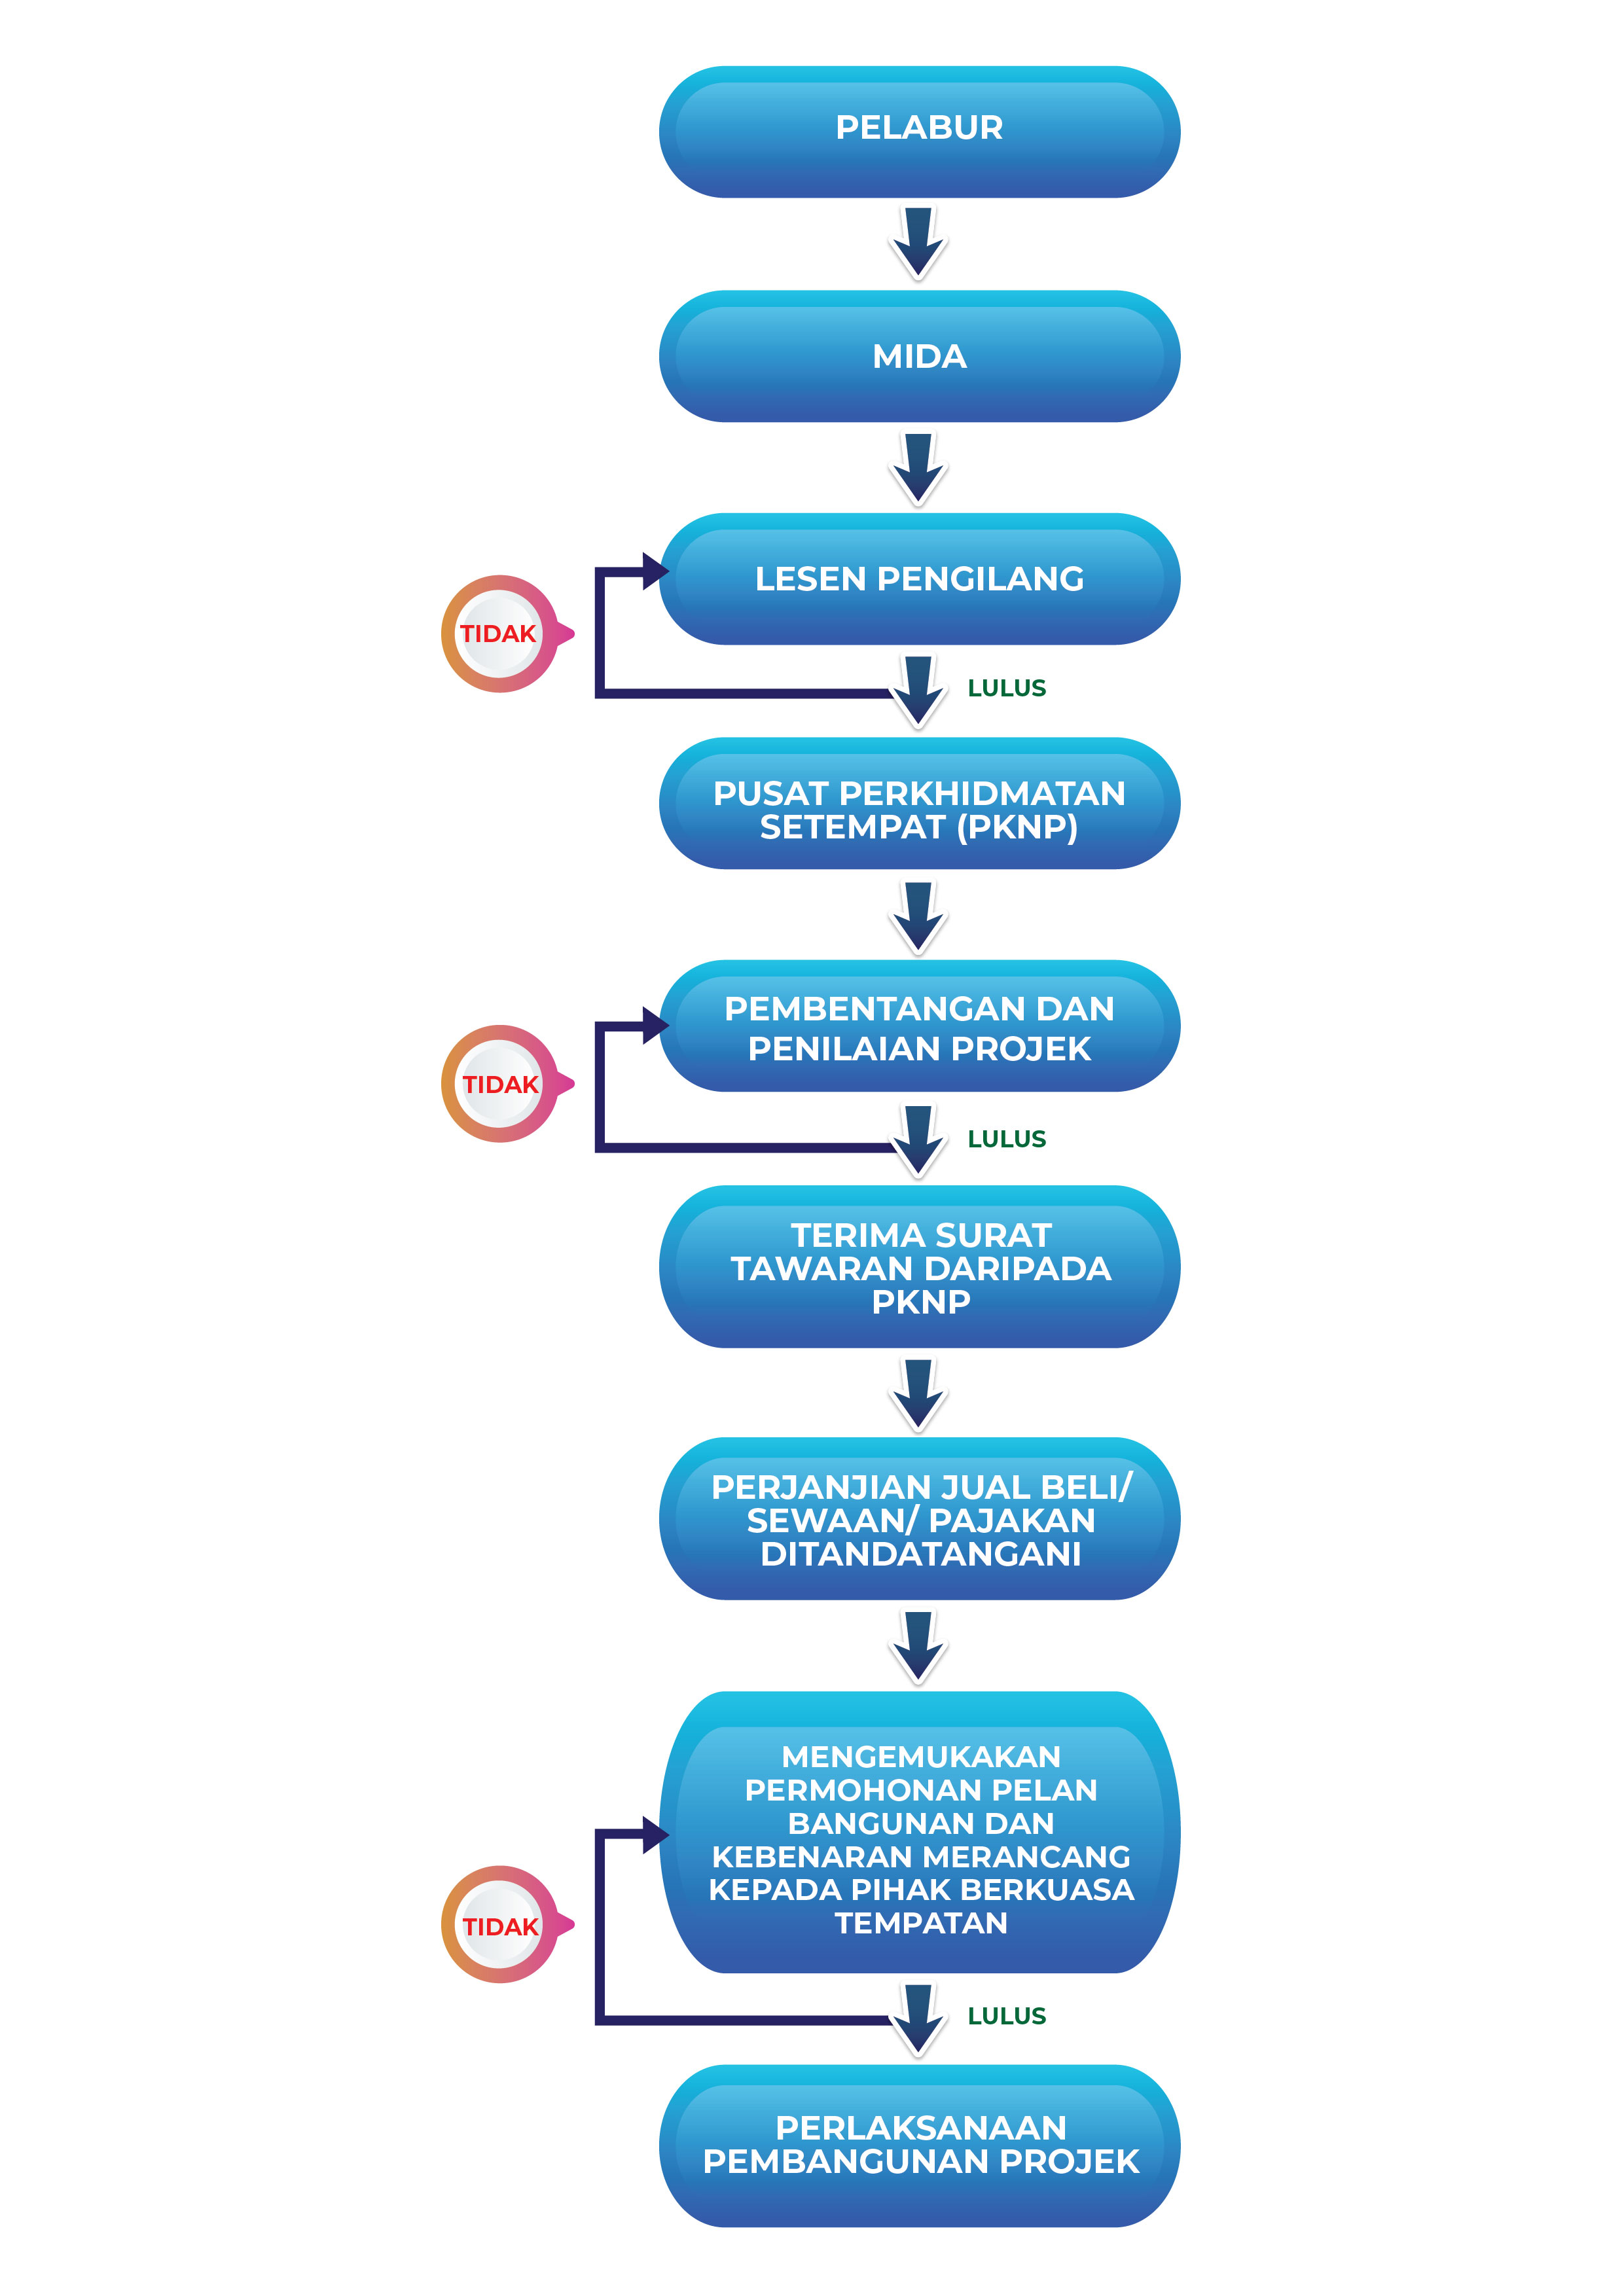
Project and Site Industrial Area Application Process Flow Chart Project and Site Industrial Area


